Skip to content
DD 20261112 MMORT holdings as of Nov 12, 2026 · prices of Nov 13, 2026 · source and date per company

The ten largest mortgage REITs in MORT, one by one.

The ten largest companies in MORT, VanEck's mortgage REIT ETF, explained in five plain questions, with a photo of each head office and a source on every figure.

What a mortgage REIT is, in three steps

  1. You buy the share

    A mortgage REIT is a US-listed company. It does not own buildings: it owns mortgages.

  2. It borrows to buy mortgages

    It borrows short-term money and buys long-term real estate securities and loans.

  3. The interest gap becomes the dividend

    It earns the gap between what it receives and what it pays, multiplied by the debt.

What draws people in
Very high dividends in dollars, paid every month or every quarter.
What can go wrong
The debt multiplies losses too: when rates rise or property loses value, book value shrinks fast. 6 of the 10 lost more than 10% of book value per share in a single quarter.

The reference fund: MORT

MORT is a VanEck ETF that holds 24 mortgage REITs in a single share. We use its holdings as a reference list, not as a recommendation.

The ten largest add up to 76.4% of the fund

The ten on this page: 76.4%Another 14 mortgage REITs and cash: 23.6%

A high dividend is not a gain

Distributed over 12 months
19.89%
Total return, year to date
-23.32%

Total return adds the dividends to the change in the share price. A falling price can take away more than the dividends pay.

More about MORT
  • The two largest positions, Annaly and AGNC, add up to more than a third of the fund. Almost half of it is in the five agency portfolios on this page.
  • The last distribution, annualized, equals 17.08% of the NAV. The 30-day SEC yield, a standardised measure of the portfolio's income, is 18.20%.
  • The total expense ratio reported by VanEck is 0.43%.

Source: VanEck (opens in a new tab), Nov 12, 2026

The ten, side by side

What each one pays in dividends a year over today's price.

  1. NLYAnnaly Capital Management, Inc.17.0%
  2. AGNCAGNC Investment Corp.17.5%
  3. RITMRithm Capital Corp.11.1%
  4. STWDStarwood Property Trust, Inc.16.9%
  5. DXDynex Capital, Inc.20.3% (needs attention: outside the Analyzer's band)
  6. EFCEllington Financial Inc.14.0%
  7. BXMTBlackstone Mortgage Trust, Inc.11.2%
  8. ARRARMOUR Residential REIT, Inc.24.1% (needs attention: outside the Analyzer's band)
  9. ORCOrchid Island Capital, Inc.25.6% (needs attention: outside the Analyzer's band)
  10. LADRLadder Capital Corp10.8%

Above 18%, the REIT Analyzer marks the yield as a signal to look closer. A very high yield usually means a falling price and more risk, not an opportunity.

Prices of Nov 13, 2026 (Yahoo Finance). Regular dividends, annualized; supplemental and special dividends are left out.

See the full table

Dividend yield is the dividend, annualized, divided by the price. Price/BV compares the price with book value per share on the latest balance sheet. Coverage is the quarter's distributable earnings divided by the dividend for the same quarter.

The ten largest positions of MORT: weight in the fund, dividend yield, price to book value, change in book value over the quarter and dividend coverage.
CompanyWeight in MORTDividend yieldPrice / BVBV in the quarterDividend coverage
NLY Annaly Capital Management, Inc.19.50%17.0%0.99x−11.4% (needs attention: outside the Analyzer's band)107%
AGNC AGNC Investment Corp.15.39%17.5%1.15x−16.9% (needs attention: outside the Analyzer's band)103%
RITM Rithm Capital Corp.7.12%11.1%0.72x (needs attention: outside the Analyzer's band)+1.5%220%
STWD Starwood Property Trust, Inc.6.31%16.9%0.66x (needs attention: outside the Analyzer's band)−7.5%65% (needs attention: outside the Analyzer's band)
DX Dynex Capital, Inc.5.29%20.3% (needs attention: outside the Analyzer's band)0.92x−15.4% (needs attention: outside the Analyzer's band)75% (needs attention: outside the Analyzer's band)
EFC Ellington Financial Inc.5.10%14.0%0.82x−0.6%115%
BXMT Blackstone Mortgage Trust, Inc.4.79%11.2%0.63x (needs attention: outside the Analyzer's band)−11.7% (needs attention: outside the Analyzer's band)81% (needs attention: outside the Analyzer's band)
ARR ARMOUR Residential REIT, Inc.4.51%24.1% (needs attention: outside the Analyzer's band)0.82x−17.0% (needs attention: outside the Analyzer's band)99% (needs attention: outside the Analyzer's band)
ORC Orchid Island Capital, Inc.4.37%25.6% (needs attention: outside the Analyzer's band)0.78x (needs attention: outside the Analyzer's band)−16.6% (needs attention: outside the Analyzer's band)—
LADR Ladder Capital Corp4.06%10.8%0.63x (needs attention: outside the Analyzer's band)+0.4%152%

BV is book value per share on the measure each company highlights: GAAP, tangible (AGNC) or undepreciated (Starwood and Ladder). The yield of Blackstone Mortgage Trust (BXMT) uses the $0.30 dividend already declared for Q4 2026; coverage compares Q3 2026 earnings with the $0.47 paid for that quarter. Orchid Island (ORC) does not publish distributable earnings.

Five questions for each company

Each entry below answers the same five questions, with one figure, one sentence and one drawing. They are the REIT Analyzer's yardsticks in plain language.

See the REIT Analyzer in the Library

  1. How much does it pay?

    One year of dividends divided by the share price. When it sits far above the others it is usually a warning of risk: it is the share price that fell.

  2. Do earnings pay the dividend?

    It compares the quarter's earnings with the dividend paid. Below 100%, the dividend is larger than the earnings behind it.

  3. Did book value per share grow?

    It is what is left per share after the debts are paid. In a mortgage REIT it is the figure that weighs most: with so much debt, it falls fast when rates rise.

  4. What does it cost against book value?

    Below 1.00x the market pays less than book value: it expects more losses. Above it, the market pays a premium.

  5. Where does the money sit?

    Agency-backed securities almost never default, but they suffer with interest rates. Credit and property can earn more and suffer with defaults.

Needs attention: the figure has moved past the band the Analyzer tracks. A rule-based signal, not a recommendation.

The ten mortgage REITs, one by one

No. 1 of 10, 19.50% of MORT

NLY

Annaly Capital Management, Inc.

Agency MBS, residential credit and MSR
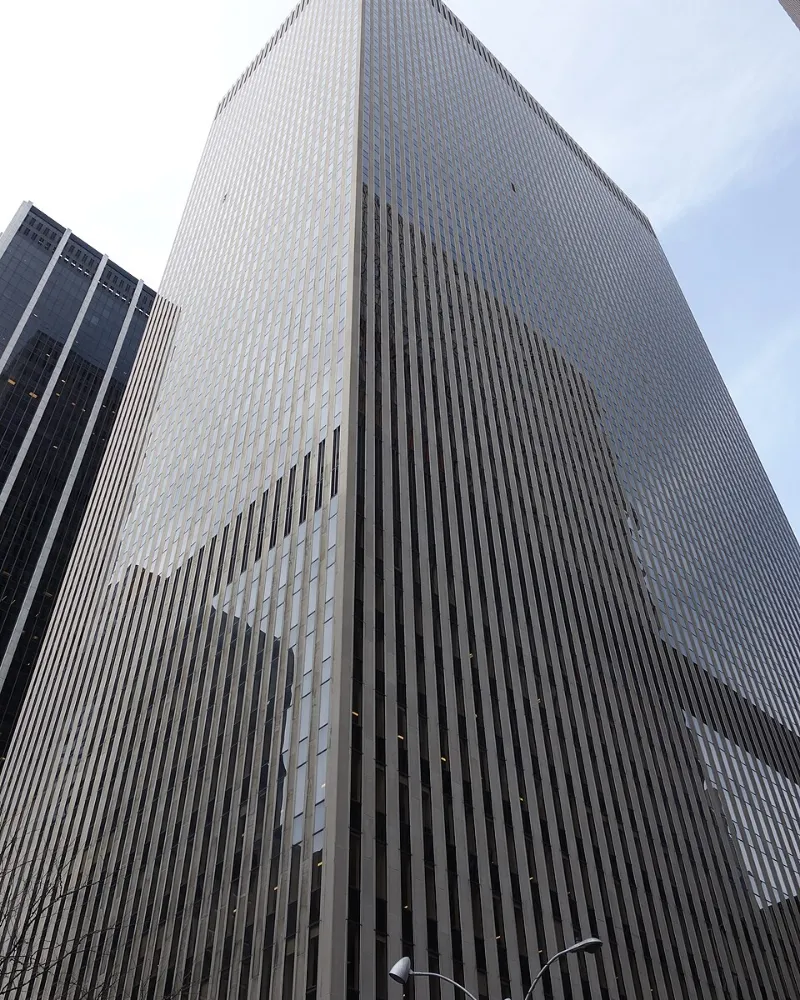
1211 Avenue of the Americas (the News Corp. Building), New York: Annaly's head office address.
1211 Avenue of the Americas (the News Corp. Building), New York: Annaly's head office address. Photo: Tdorante10 (opens in a new tab), CC BY-SA 4.0 (opens in a new tab), via Wikimedia Commons. Image cropped and printed in one ink; the adaptation carries the same licence.
Head office: 1211 Avenue of the Americas, New York

The largest position in MORT. It buys mortgage securities backed by US federal agencies (agency MBS) funded with repo, and puts almost half of its capital into two other lines: residential credit and mortgage servicing rights (MSR).

How much does it pay?

17.0%

A year. For every $100 invested at today's price ($17.65), about $17.00 a year in regular dividends, before taxes.

$0.75 a quarter.

Do earnings pay the dividend?

107%

Earnings available for distribution (EAD) for the quarter paid the whole dividend.

Earnings available for distribution (EAD) per share for the quarter
$0.80
Dividend per share for the quarter
$0.75

Did book value per share grow?

−7.2%

Needs attention: fell more than 10% in one quarter

Change over 12 months. Book value per share of $17.86 on the latest balance sheet (−11.4% in the quarter).

A year ago
$19.25
Previous quarter
$20.15
Latest balance sheet
$17.86

What does it cost against book value?

0.99x

The share costs $17.65 and book value per share is $17.86. You pay $0.99 for every $1.00 of book value: a 1% discount.

Where does the money sit?

A portfolio of $106.5bn. By capital allocated.

  • Agency-backed securities55%
  • Residential credit23%
  • Servicing rights (MSR)22%

What to watch

  • Book value per share fell from $20.15 to $17.86 in Q3 2026, an economic return of −7.6% for the quarter after counting the dividend.
  • It raised the dividend from $0.70 to $0.75 in June 2026. Q3 2026 distributable earnings of $0.80 a share cover the new amount; the GAAP result was a loss of $1.36.
  • Economic leverage of 5.9x, the lowest of the five agency portfolios on the list. During the quarter it issued $757 million of new shares.
More figures for NLY
Management
Internally managed
Head office
1211 Avenue of the Americas, New York
Exchange
NYSE, since 1997
Book value per share
$17.86
GAAP.
Earnings per share (earnings available for distribution (EAD))
$0.80
GAAP result: −$1.36 a share.
Leverage (debt to equity)
5.9x
Economic; 5.6x in Q2 2026.
Portfolio size
$106.5bn
Total portfolio, including TBA.
Where the capital sits
Agency 55%, residential credit 23%, MSR 22%
Economic return for the quarter
−7.6%
Net interest margin (ex-PAA)
1.69% (1.76% in Q2 2026)
Hedge ratio
100% (97% in Q2 2026)

Q3 2026 balance sheet (Sep 30, 2026), reported Oct 20, 2026. Sources: Annaly, Q3 2026 results (opens in a new tab), Oct 20, 2026; Q3 2026 Form 10-Q (SEC) (opens in a new tab), Oct 28, 2026; Dividend increase (opens in a new tab), Jun 10, 2026; price: Yahoo Finance, Nov 13, 2026.

No. 2 of 10, 15.39% of MORT

AGNC

AGNC Investment Corp.

Agency MBS

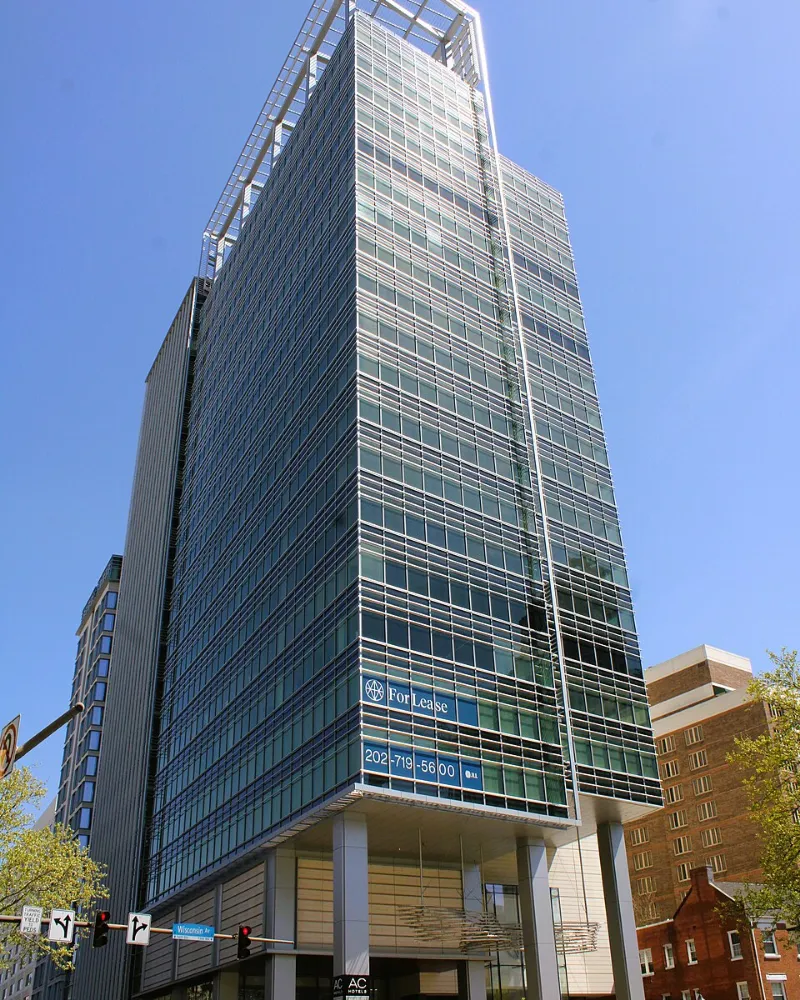
Avocet Tower, 7373 Wisconsin Avenue, Bethesda, Maryland: AGNC's head office is on the 22nd floor.
Avocet Tower, 7373 Wisconsin Avenue, Bethesda, Maryland: AGNC's head office is on the 22nd floor. Photo: Farragutful (opens in a new tab), CC BY-SA 4.0 (opens in a new tab), via Wikimedia Commons. Image cropped and printed in one ink; the adaptation carries the same licence.
Head office: 7373 Wisconsin Avenue, Bethesda, Maryland

The purest agency MBS case on the list: $94 billion of mortgage securities backed by federal agencies, almost all 30-year fixed rate, funded with repo. There is little default risk; the risks are rates, spreads and leverage.

How much does it pay?

17.5%

A year. For every $100 invested at today's price ($8.23), about $17.50 a year in regular dividends, before taxes.

$0.12 a month, the same amount since April 2020.

Do earnings pay the dividend?

103%

Net spread and dollar roll income for the quarter paid the whole dividend.

Net spread and dollar roll income per share for the quarter
$0.37
Dividend per share for the quarter
$0.36

Did book value per share grow?

−13.9%

Needs attention: fell more than 10% in one quarter

Change over 12 months. Book value per share of $7.13 on the latest balance sheet (−16.9% in the quarter).

A year ago
$8.28
Previous quarter
$8.58
Latest balance sheet
$7.13

What does it cost against book value?

1.15x

The share costs $8.23 and book value per share is $7.13. You pay $1.15 for every $1.00 of book value: a 15% premium.

Where does the money sit?

A portfolio of $94.4bn.

  • Agency-backed securities99.4%
  • Credit0.6%

What to watch

  • Tangible book value per share fell 16.9% in Q3 2026, from $8.58 to $7.13. On the earnings call the company reported a rise of about 3% through Oct 16, 2026.
  • The quarter's recurring earnings ($0.37 a share) cover the $0.36 of dividends by one cent, with the net spread down from 2.00% to 1.86%.
  • Leverage of 7.9x, close to the 8x band the REIT Analyzer tracks for agency. During the quarter it issued $992 million of new shares.
More figures for AGNC
Management
Internally managed
Head office
7373 Wisconsin Avenue, Bethesda, Maryland
Exchange
Nasdaq, since 2008
Book value per share
$7.13
Tangible.
Earnings per share (net spread and dollar roll income)
$0.37
GAAP result: −$1.17 a share.
Leverage (debt to equity)
7.9x
At-risk on tangible equity; 7.4x in Q2 2026.
Portfolio size
$94.4bn
Including TBA.
Mix
Agency MBS $91.4bn, TBA $2.4bn, credit $0.6bn
Economic return for the quarter
−12.7%
Net interest spread
1.86% (2.00% in Q2 2026)
Hedge ratio and duration gap
90% (73% in Q2 2026); 0.8 years

Q3 2026 balance sheet (Sep 30, 2026), reported Oct 19, 2026. Sources: AGNC, Q3 2026 results (opens in a new tab), Oct 19, 2026; Q3 2026 Form 10-Q (SEC) (opens in a new tab), Oct 29, 2026; Q3 2026 earnings call (transcript, Motley Fool) (opens in a new tab), Oct 20, 2026; price: Yahoo Finance, Nov 13, 2026.
No. 3 of 10, 7.12% of MORT

RITM

Rithm Capital Corp.

Servicing, credit and asset management

799 Broadway at 11th Street, New York: Rithm's head office address.
799 Broadway at 11th Street, New York: Rithm's head office address. Photo: Kenneth C. Zirkel (opens in a new tab), CC BY-SA 4.0 (opens in a new tab), via Wikimedia Commons. Image cropped and printed in one ink; the adaptation carries the same licence.
Head office: 799 Broadway, New York

The former New Residential. Today it is a group: Newrez originates mortgages and services $879 billion of loans; Genesis Capital finances residential builders and investors; Sculptor and Crestline manage about $61 billion for third parties; and Elecor (the former Paramount Group, bought in December 2025) owns office buildings in New York and San Francisco.

How much does it pay?

11.1%

A year. For every $100 invested at today's price ($8.97), about $11.15 a year in regular dividends, before taxes.

$0.25 a quarter, unchanged since at least 2023.

Do earnings pay the dividend?

220%

Earnings available for distribution (EAD) for the quarter paid the whole dividend.

Earnings available for distribution (EAD) per share for the quarter
$0.55
Dividend per share for the quarter
$0.25

Did book value per share grow?

−2.5%

Change over 12 months. Book value per share of $12.51 on the latest balance sheet (+1.5% in the quarter).

A year ago
$12.83
Previous quarter
$12.33
Latest balance sheet
$12.51

What does it cost against book value?

0.72x

Needs attention: below 0.80x

The share costs $8.97 and book value per share is $12.51. You pay $0.72 for every $1.00 of book value: a 28% discount.

Where does the money sit?

A portfolio of $56.7bn. Assets by segment.

  • Mortgage origination and servicing51.5%
  • Investment portfolio21.5%
  • Builder lending9.5%
  • Commercial property, asset management and other17.5%

What to watch

  • It now works more like a servicer and an asset manager than a classic mortgage REIT: the origination and servicing segment produced $1.2 billion of the quarter's $1.76 billion of revenue.
  • Distributable earnings ($0.55 a share) are more than twice the $0.25 dividend; the company retains the difference.
  • The purchase of Paramount Group in December 2025 put office buildings on the balance sheet, a direct property risk. In October 2026 it shared one of them, 1301 Avenue of the Americas, with a partner.
More figures for RITM
Management
Internally managed since 2022
Head office
799 Broadway, New York
Exchange
NYSE, since 2013
Book value per share
$12.51
GAAP.
Earnings per share (earnings available for distribution (EAD))
$0.55
GAAP result: $0.38 a share.
Portfolio size
$56.7bn
Total assets.
Assets by segment
Origination and servicing $29.2bn, investment portfolio $12.2bn, builder lending $5.4bn, commercial real estate $4.9bn, asset management $4.5bn
Mortgage servicing rights (MSR)
$12.2bn at fair value
Origination in the quarter
$12.9bn

Q3 2026 balance sheet (Sep 30, 2026), reported Oct 23, 2026. Sources: Rithm Capital, Q3 2026 results (opens in a new tab), Oct 23, 2026; Q3 2026 Form 10-Q (SEC) (opens in a new tab), Nov 2, 2026; 1301 Avenue of the Americas joint venture (opens in a new tab), Oct 2, 2026; price: Yahoo Finance, Nov 13, 2026.

No. 4 of 10, 6.31% of MORT

STWD

Starwood Property Trust, Inc.

Commercial real estate credit

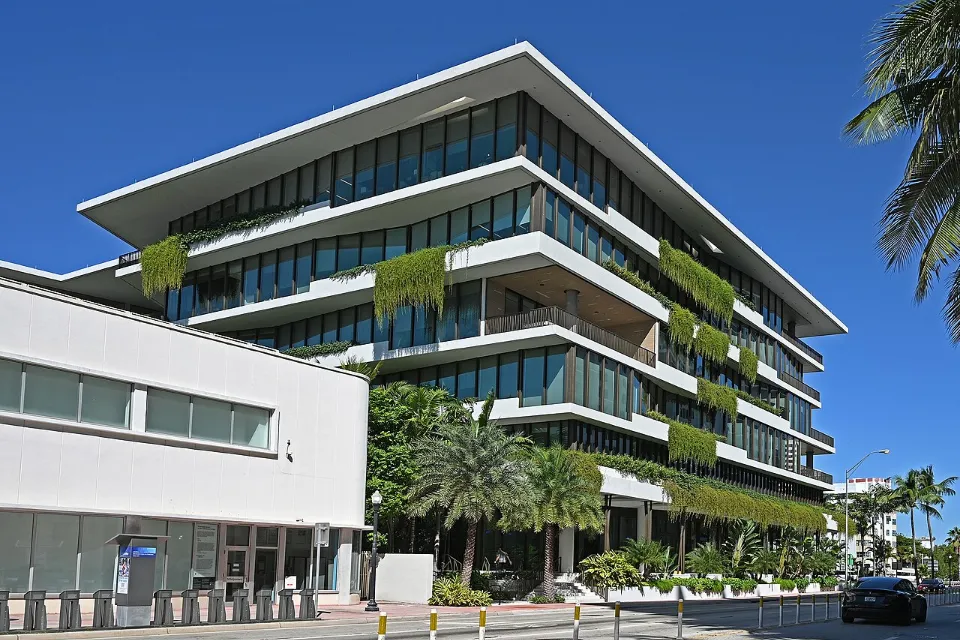
2340 Collins Avenue, Miami Beach: Starwood Capital's headquarters, home of Starwood Property Trust. Completed in 2021.
2340 Collins Avenue, Miami Beach: Starwood Capital's headquarters, home of Starwood Property Trust. Completed in 2021. Photo: P. Hughes (opens in a new tab), CC BY 4.0 (opens in a new tab), via Wikimedia Commons. Image cropped and printed in one ink; the adaptation carries the same licence.
Head office: 2340 Collins Avenue, Miami Beach, Florida

The largest commercial real estate lender on the list, managed by Starwood Capital. More than half of the assets are loans on commercial property in the US, Europe and Australia; the rest is owned real estate (20%), infrastructure lending, residential lending and a CMBS servicing business.

How much does it pay?

16.9%

A year. For every $100 invested at today's price ($11.34), about $16.93 a year in regular dividends, before taxes.

$0.48 a quarter, the same amount since 2014.

Do earnings pay the dividend?

65%

Needs attention: below 100%

Distributable earnings for the quarter did not pay the whole dividend: it fell $0.17 a share short.

Distributable earnings per share for the quarter
$0.31
Dividend per share for the quarter
$0.48

Did book value per share grow?

−11.2%

Change over 12 months. Book value per share of $17.22 on the latest balance sheet (−7.5% in the quarter).

A year ago
$19.39
Previous quarter
$18.62
Latest balance sheet
$17.22

What does it cost against book value?

0.66x

Needs attention: below 0.80x

The share costs $11.34 and book value per share is $17.22. You pay $0.66 for every $1.00 of book value: a 34% discount.

Where does the money sit?

A portfolio of $32.3bn. Undepreciated assets.

  • Commercial real estate loans53%
  • Owned property20%
  • Infrastructure lending9%
  • Residential lending and other18%

What to watch

  • Q3 2026 distributable earnings ($0.31 a share, or $0.41 before realized losses) came in below the $0.48 dividend, which the company has paid unchanged since 2014.
  • A GAAP loss of $1.08 a share for the quarter, with a $337 million credit loss provision. Undepreciated book value fell from $18.62 to $17.22.
  • Office is $2.8 billion of the $17.8 billion commercial lending portfolio (about 16%), and the loans' average risk rating is 3.0 on a 1-to-5 scale.
More figures for STWD
Management
SPT Management, part of Starwood Capital Group
Head office
2340 Collins Avenue, Miami Beach, Florida
Exchange
NYSE, since 2009
Book value per share
$17.22
Undepreciated, the company's measure; GAAP is $16.03.
Earnings per share (distributable earnings)
$0.31
$0.41 before realized losses. GAAP result: −$1.08 a share.
Leverage (debt to equity)
3.15x
Adjusted debt to equity.
Portfolio size
$32.3bn
Undepreciated assets.
Asset mix
Commercial loans 53%, owned property 20%, infrastructure 9%, residential lending 8%
Credit loss allowance
$704m ($441m at Dec 31, 2025)
On non-accrual
$588m of loans and $104m of preferred interests
Foreclosed real estate
$770m

Q3 2026 balance sheet (Sep 30, 2026), reported Nov 6, 2026. Sources: Starwood Property Trust, Q3 2026 results (opens in a new tab), Nov 6, 2026; Q3 2026 earnings deck (opens in a new tab), Nov 6, 2026; Q3 2026 Form 10-Q (SEC) (opens in a new tab), Nov 6, 2026; price: Yahoo Finance, Nov 13, 2026.

No. 5 of 10, 5.29% of MORT

DX

Dynex Capital, Inc.

Agency MBS

Innsbrook, the office district of Glen Allen, Virginia, where Dynex was based until it moved to 140 Eastshore Drive, a few kilometres away. We found no freely licensed photo of the current building.
Innsbrook, the office district of Glen Allen, Virginia, where Dynex was based until it moved to 140 Eastshore Drive, a few kilometres away. We found no freely licensed photo of the current building. Photo: Packer1028 (opens in a new tab), CC0 1.0 (opens in a new tab), via Wikimedia Commons. Image cropped and printed in one ink; the adaptation carries the same licence.
Head office: 140 Eastshore Drive, Glen Allen, Virginia

A $28 billion portfolio almost entirely in securities backed by federal agencies: 95% residential and 5% commercial, funded with repo. Operating since 1988, internally managed.

How much does it pay?

20.3%

Needs attention: above 18%

A year. For every $100 invested at today's price ($10.07), about $20.26 a year in regular dividends, before taxes.

$0.17 a month.

Do earnings pay the dividend?

75%

Needs attention: below 100%

Earnings available for distribution (EAD) for the quarter did not pay the whole dividend: it fell $0.13 a share short.

Earnings available for distribution (EAD) per share for the quarter
$0.38
Dividend per share for the quarter
$0.51

Did book value per share grow?

−13.9%

Needs attention: fell more than 10% in one quarter

Change over 12 months. Book value per share of $10.91 on the latest balance sheet (−15.4% in the quarter).

A year ago
$12.67
Previous quarter
$12.90
Latest balance sheet
$10.91

What does it cost against book value?

0.92x

The share costs $10.07 and book value per share is $10.91. You pay $0.92 for every $1.00 of book value: a 8% discount.

Where does the money sit?

A portfolio of $28.3bn.

  • Residential agency95%
  • Commercial agency5%

What to watch

  • Q3 2026 distributable earnings were $0.38 a share against $0.51 paid in monthly dividends: on that measure, coverage is 75%.
  • Book value per share fell 15.4% in the quarter, from $12.90 to $10.91.
  • Leverage of 9.0x including TBA, the highest on the list. It raised $384 million in the quarter, $116 million of it in preferred stock at 9.375% a year.
More figures for DX
Management
Internally managed
Head office
140 Eastshore Drive, Glen Allen, Virginia
Exchange
NYSE
Book value per share
$10.91
GAAP.
Earnings per share (earnings available for distribution (EAD))
$0.38
GAAP result: −$1.34 a share.
Leverage (debt to equity)
9.0x (needs attention: outside the Analyzer's band)
Including TBA; 8.1x in Q2 2026.
Portfolio size
$28.3bn
Including TBA.
Economic return for the quarter
−11.5%
Net interest spread
1.18% (1.16% in Q2 2026)
Hedges
$17.6bn of swaps and $6.7bn of Treasury futures, against $24.2bn of repo

Q3 2026 balance sheet (Sep 30, 2026), reported Oct 19, 2026. Sources: Dynex Capital, Q3 2026 results (via Yahoo Finance) (opens in a new tab), Oct 19, 2026; Q3 2026 Form 10-Q (SEC) (opens in a new tab), Oct 27, 2026; Q3 2026 earnings presentation (opens in a new tab), Oct 19, 2026; price: Yahoo Finance, Nov 13, 2026.
No. 6 of 10, 5.10% of MORT

EFC

Ellington Financial Inc.

Residential and commercial credit

Old Greenwich station, Connecticut, from above, in the neighbourhood of Ellington's head office (53 Forest Avenue). We found no freely licensed photo of the building.
Old Greenwich station, Connecticut, from above, in the neighbourhood of Ellington's head office (53 Forest Avenue). We found no freely licensed photo of the building. Photo: Hayden Soloviev (opens in a new tab), CC BY 4.0 (opens in a new tab), via Wikimedia Commons. Image cropped and printed in one ink; the adaptation carries the same licence.
Head office: 53 Forest Avenue, Old Greenwich, Connecticut

A credit mortgage REIT, not an agency one. It buys and securitizes residential mortgages outside agency standards (non-QM), residential transition loans and short-term commercial real estate loans, and owns Longbridge, a reverse mortgage originator.

How much does it pay?

14.0%

A year. For every $100 invested at today's price ($11.11), about $14.04 a year in regular dividends, before taxes.

$0.13 a month.

Do earnings pay the dividend?

115%

Adjusted distributable earnings for the quarter paid the whole dividend.

Adjusted distributable earnings per share for the quarter
$0.45
Dividend per share for the quarter
$0.39

Did book value per share grow?

+1.0%

Change over 12 months. Book value per share of $13.53 on the latest balance sheet (−0.6% in the quarter).

A year ago
$13.40
Previous quarter
$13.61
Latest balance sheet
$13.53

What does it cost against book value?

0.82x

The share costs $11.11 and book value per share is $13.53. You pay $0.82 for every $1.00 of book value: a 18% discount.

Where does the money sit?

A portfolio of $4.70bn. Investment portfolio.

  • Non-agency mortgages (non-QM)38.8%
  • Residential transition loans19%
  • Commercial mortgage loans15.1%
  • Other27.1%

What to watch

  • The main risk is default, not rates. Book value per share was almost flat in the quarter ($13.61 to $13.53), while the five agency portfolios on the list lost 11% to 17%.
  • Adjusted distributable earnings ($0.45 a share) cover the $0.39 paid in the quarter.
  • Recourse debt is 2.2x equity, but reaches 9.4x once the non-recourse securitizations consolidated on the balance sheet are added. During the quarter it bought control of Statebridge, which services $1.9 billion of loans.
More figures for EFC
Management
Ellington Financial Management, part of Ellington Management Group
Head office
53 Forest Avenue, Old Greenwich, Connecticut
Exchange
NYSE, since 2010
Book value per share
$13.53
GAAP.
Earnings per share (adjusted distributable earnings)
$0.45
GAAP result: $0.31 a share.
Leverage (debt to equity)
2.2x
Recourse debt; 9.4x including non-recourse securitizations.
Portfolio size
$4.70bn
Adjusted portfolio, excluding Longbridge ($1.03bn).
Portfolio mix
Non-QM 39%, residential transition loans 19%, commercial mortgage loans 15%, second lien and HELOC 6%
Unencumbered assets
$1.92bn

Q3 2026 balance sheet (Sep 30, 2026), reported Nov 4, 2026. Sources: Ellington Financial, Q3 2026 results (via Morningstar) (opens in a new tab), Nov 4, 2026; Form 8-K of Nov 4, 2026 (SEC) (opens in a new tab), Nov 4, 2026; Dividend history (opens in a new tab), Nov 5, 2026; price: Yahoo Finance, Nov 13, 2026.
No. 7 of 10, 4.79% of MORT

BXMT

Blackstone Mortgage Trust, Inc.

Commercial real estate credit

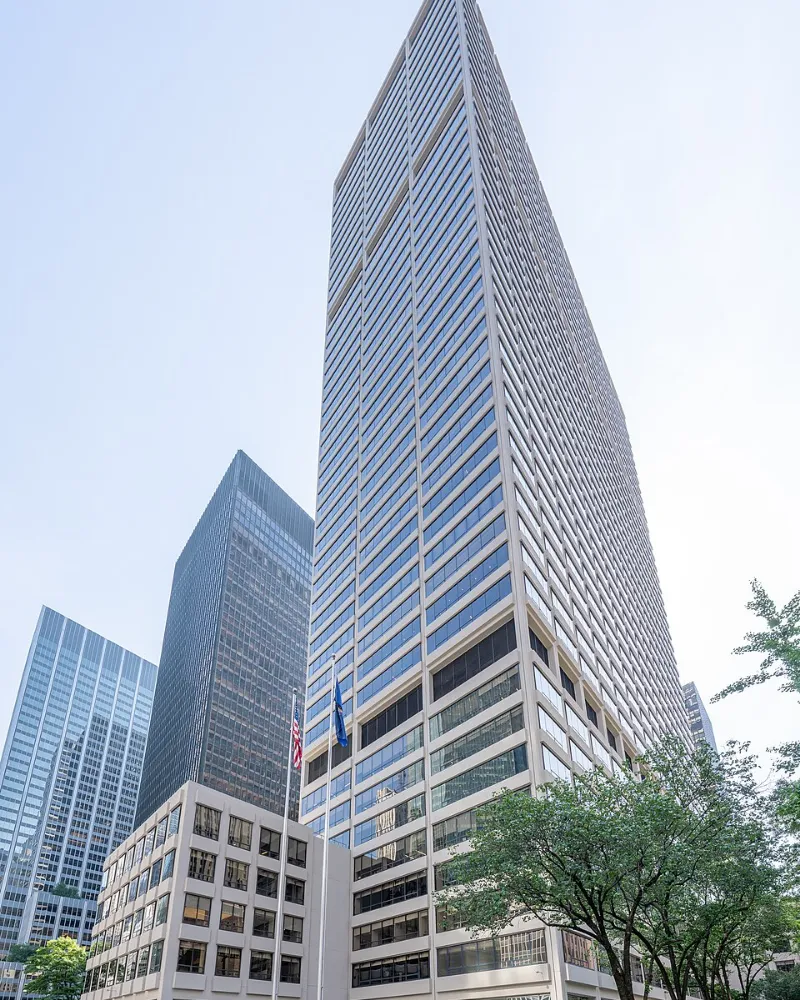
345 Park Avenue, New York: Blackstone's headquarters and Blackstone Mortgage Trust's address.
345 Park Avenue, New York: Blackstone's headquarters and Blackstone Mortgage Trust's address. Photo: Ajay Suresh (opens in a new tab), CC BY 4.0 (opens in a new tab), via Wikimedia Commons. Image cropped and printed in one ink; the adaptation carries the same licence.
Head office: 345 Park Avenue, New York

Blackstone's listed commercial real estate credit arm (the former Capital Trust, renamed in 2013). It lends on first mortgages over commercial buildings in the US and Europe: 114 loans add up to $14 billion, and another $1.5 billion is real estate that has moved onto the balance sheet.

How much does it pay?

11.2%

A year. For every $100 invested at today's price ($10.69), about $11.23 a year in regular dividends, before taxes.

$0.30 declared for Q4 2026 (payable Jan 15, 2027); for Q3 2026 it paid $0.47.

Do earnings pay the dividend?

81%

Needs attention: below 100%

Distributable earnings for the quarter did not pay the whole dividend: it fell $0.09 a share short.

Distributable earnings per share for the quarter
$0.38
Dividend per share for the quarter
$0.47

Did book value per share grow?

−18.7%

Needs attention: fell more than 10% in one quarter

Change over 12 months. Book value per share of $17.06 on the latest balance sheet (−11.7% in the quarter).

A year ago
$20.99
Previous quarter
$19.31
Latest balance sheet
$17.06

What does it cost against book value?

0.63x

Needs attention: below 0.80x

The share costs $10.69 and book value per share is $17.06. You pay $0.63 for every $1.00 of book value: a 37% discount.

Where does the money sit?

A portfolio of $17.0bn. Investment portfolio.

  • Commercial real estate loans82%
  • Real estate moved onto the balance sheet9%
  • Joint ventures and securities9%

What to watch

  • Q3 2026 distributable earnings ($0.38 a share) came in below the $0.47 paid for the quarter. For Q4 2026 the declared dividend is $0.30.
  • A loss of $1.95 a share in Q3 2026, with a $265 million increase in loss reserves; book value per share fell from $19.31 to $17.06.
  • Office is 23% of the loan portfolio. In Q3 and early Q4 it sold almost $1 billion of loans at 93% of carrying value, half of them office loans.
More figures for BXMT
Management
BXMT Advisors, part of Blackstone
Head office
345 Park Avenue, New York
Exchange
NYSE, since 2013
Book value per share
$17.06
GAAP.
Earnings per share (distributable earnings)
$0.38
$0.42 before realized losses; against the $0.47 dividend paid for Q3 2026. GAAP result: −$1.95 a share.
Leverage (debt to equity)
3.9x
Debt to equity, excluding securitized debt.
Portfolio size
$17.0bn
Investment portfolio; $19.7bn in Q2 2026.
Loans by property type
Multifamily 27%, industrial 24%, office 23% (18% US), hospitality 12%
Credit loss reserves (CECL)
$606m, or $3.64 a share
Loans risk-rated 4 and 5
$864m and $879m
Performing loans
93% of the portfolio

Q3 2026 balance sheet (Sep 30, 2026), reported Oct 29, 2026. Sources: Blackstone Mortgage Trust, Q3 2026 results (opens in a new tab), Oct 29, 2026; Q3 2026 earnings presentation (SEC) (opens in a new tab), Oct 29, 2026; Q3 2026 Form 10-Q (SEC) (opens in a new tab), Oct 29, 2026; price: Yahoo Finance, Nov 13, 2026.
No. 8 of 10, 4.51% of MORT

ARR

ARMOUR Residential REIT, Inc.

Agency MBS

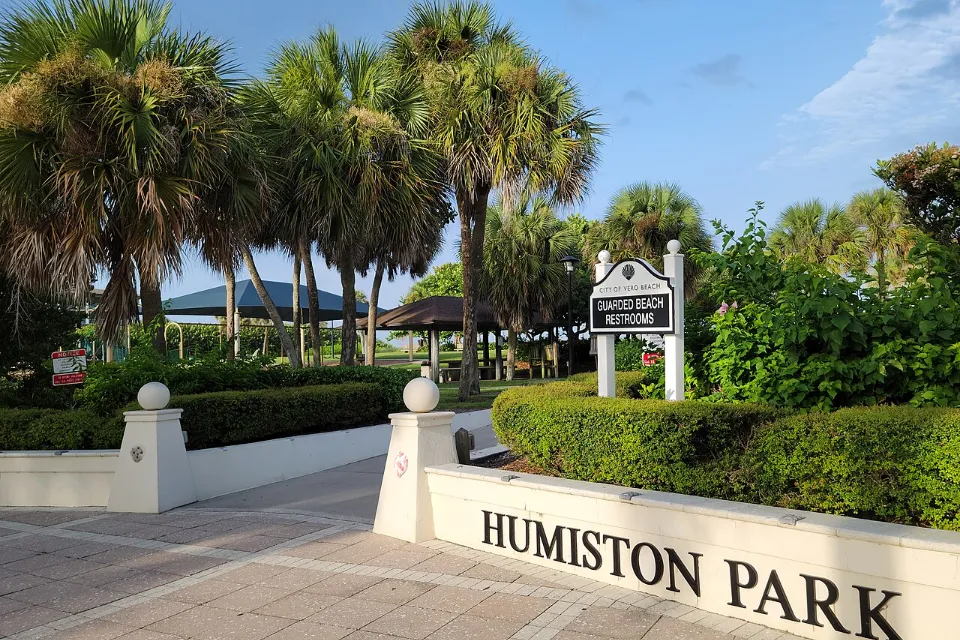
The entrance to Humiston Beach Park on Ocean Drive, Vero Beach, Florida: the street of ARMOUR's head office (3001 Ocean Drive). We found no freely licensed photo of the building.
The entrance to Humiston Beach Park on Ocean Drive, Vero Beach, Florida: the street of ARMOUR's head office (3001 Ocean Drive). We found no freely licensed photo of the building. Photo: GreaterPonce665 (opens in a new tab), CC BY-SA 4.0 (opens in a new tab), via Wikimedia Commons. Image cropped and printed in one ink; the adaptation carries the same licence.
Head office: 3001 Ocean Drive, Vero Beach, Florida

Residential agency MBS funded with repo, externally managed. The $21 billion portfolio is 94% agency securities, plus Treasuries and TBA. It pays a monthly dividend.

How much does it pay?

24.1%

Needs attention: above 18%

A year. For every $100 invested at today's price ($11.93), about $24.14 a year in regular dividends, before taxes.

$0.24 a month since January 2024.

Do earnings pay the dividend?

99%

Needs attention: below 100%

Distributable earnings for the quarter did not pay the whole dividend: it fell $0.01 a share short.

Distributable earnings per share for the quarter
$0.71
Dividend per share for the quarter
$0.72

Did book value per share grow?

−16.8%

Needs attention: fell more than 10% in one quarter

Change over 12 months. Book value per share of $14.55 on the latest balance sheet (−17.0% in the quarter).

A year ago
$17.49
Previous quarter
$17.53
Latest balance sheet
$14.55

What does it cost against book value?

0.82x

The share costs $11.93 and book value per share is $14.55. You pay $0.82 for every $1.00 of book value: a 18% discount.

Where does the money sit?

A portfolio of $21.3bn.

  • Agency-backed securities94%
  • TBA3.8%
  • Treasuries2.2%

What to watch

  • Book value per share fell 17% in Q3 2026, from $17.53 to $14.55. The company's estimate on Nov 9, 2026 was $15.52 to $15.62.
  • The $0.24 monthly dividend followed a one-for-five reverse stock split in September 2023. The quarter's distributable earnings ($0.71) sit one cent below the $0.72 paid.
  • It sold 36.9 million new shares in nine months ($640 million). Half of its repo is borrowed from BUCKLER Securities, a broker-dealer affiliated with ARMOUR itself.
More figures for ARR
Management
ARMOUR Capital Management
Head office
3001 Ocean Drive, Vero Beach, Florida
Exchange
NYSE, since 2009
Book value per share
$14.55
GAAP.
Earnings per share (distributable earnings)
$0.71
GAAP result: −$2.26 a share.
Leverage (debt to equity)
8.24x (needs attention: outside the Analyzer's band)
Repo to equity; 8.41x including TBA.
Portfolio size
$21.3bn
Including TBA and Treasuries.
Economic return for the quarter
−12.9%
Economic net interest spread
1.83% (1.82% in Q2 2026)
Hedges
$17.0bn of swaps against $19.4bn of repo

Q3 2026 balance sheet (Sep 30, 2026), reported Oct 21, 2026. Sources: ARMOUR, Q3 2026 results (opens in a new tab), Oct 21, 2026; Q3 2026 Form 10-Q (SEC) (opens in a new tab), Oct 21, 2026; November book value estimate (opens in a new tab), Nov 10, 2026; price: Yahoo Finance, Nov 13, 2026.

No. 9 of 10, 4.37% of MORT

ORC

Orchid Island Capital, Inc.

Agency MBS

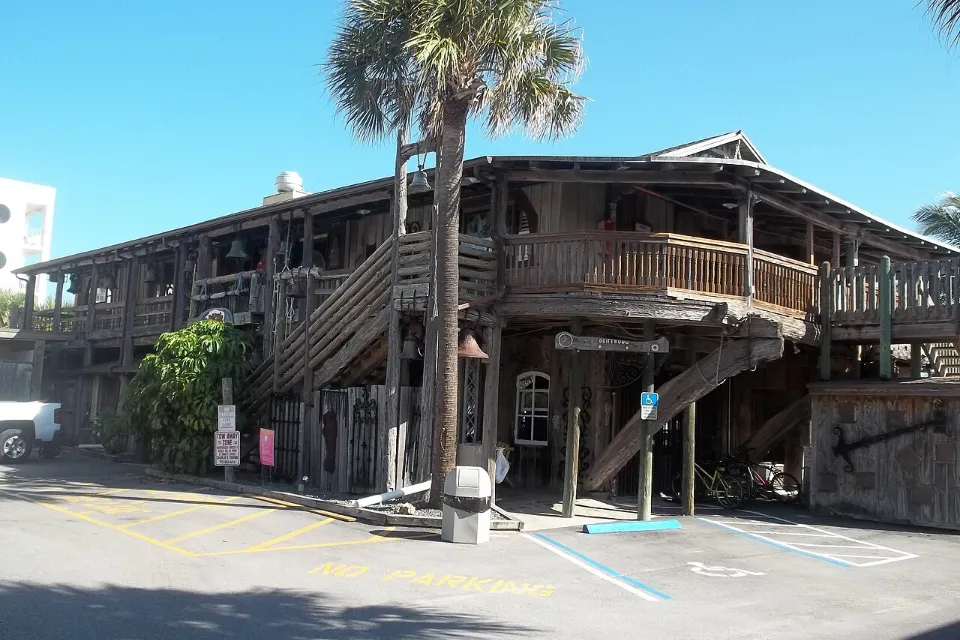
The Driftwood Inn, a historic landmark on the oceanfront of Vero Beach, Florida, the town of Orchid Island's head office (3305 Flamingo Drive). We found no freely licensed photo of the building.
The Driftwood Inn, a historic landmark on the oceanfront of Vero Beach, Florida, the town of Orchid Island's head office (3305 Flamingo Drive). We found no freely licensed photo of the building. Photo: Ebyabe (opens in a new tab), CC BY-SA 4.0 (opens in a new tab), via Wikimedia Commons. Image cropped and printed in one ink; the adaptation carries the same licence.
Head office: 3305 Flamingo Drive, Vero Beach, Florida

The smallest agency portfolio on the list: $10.7 billion of residential agency mortgage securities, almost all fixed rate, levered with repo. Externally managed, monthly dividend.

How much does it pay?

25.6%

Needs attention: above 18%

A year. For every $100 invested at today's price ($4.68), about $25.64 a year in regular dividends, before taxes.

$0.10 a month.

Do earnings pay the dividend?

—

The company does not publish distributable earnings, so this sum cannot be done.

Dividend per share for the quarter
$0.30

Did book value per share grow?

−17.9%

Needs attention: fell more than 10% in one quarter

Change over 12 months. Book value per share of $6.02 on the latest balance sheet (−16.6% in the quarter).

A year ago
$7.33
Previous quarter
$7.22
Latest balance sheet
$6.02

What does it cost against book value?

0.78x

Needs attention: below 0.80x

The share costs $4.68 and book value per share is $6.02. You pay $0.78 for every $1.00 of book value: a 22% discount.

Where does the money sit?

A portfolio of $10.7bn.

  • Agency-backed securities99.9%
  • Other0.1%

What to watch

  • Economic leverage rose from 7.3x to 8.6x in the quarter. Over the same period the company bought back about 4.95 million shares.
  • Book value per share fell from $7.22 to $6.02 in Q3 2026. The company's estimate on Nov 6, 2026 was $6.52 to $6.54.
  • The company does not publish distributable earnings. Net interest income for the quarter was $0.30 a share, the same as the dividends, before expenses.
More figures for ORC
Management
Bimini Advisors, part of Bimini Capital Management
Head office
3305 Flamingo Drive, Vero Beach, Florida
Exchange
NYSE, since 2013
Book value per share
$6.02
GAAP.
Earnings per share (distributable earnings)
—
The company does not publish this measure. GAAP result: −$0.90 a share.
Leverage (debt to equity)
8.6x (needs attention: outside the Analyzer's band)
Economic; 7.3x in Q2 2026.
Portfolio size
$10.7bn
Securities at fair value, excluding TBA.
Total return for the quarter
−12.47%
Net interest income
$0.30 a share, before $0.03 of expenses
Economic interest rate spread
2.48% (2.41% in Q2 2026)

Q3 2026 balance sheet (Sep 30, 2026), reported Oct 22, 2026. Sources: Orchid Island Capital, Q3 2026 results (opens in a new tab), Oct 22, 2026; Q3 2026 Form 10-Q (SEC) (opens in a new tab), Oct 23, 2026; November dividend and book value estimate (opens in a new tab), Nov 10, 2026; price: Yahoo Finance, Nov 13, 2026.

No. 10 of 10, 4.06% of MORT

LADR

Ladder Capital Corp

Commercial real estate credit

320 Park Avenue (the Mutual of America Building), New York: Ladder's head office is on the 15th floor.
320 Park Avenue (the Mutual of America Building), New York: Ladder's head office is on the 15th floor. Photo: Beyond My Ken (opens in a new tab), CC BY-SA 4.0 (opens in a new tab), via Wikimedia Commons. Image cropped and printed in one ink; the adaptation carries the same licence.
Head office: 320 Park Avenue, New York

A mid-sized commercial real estate lender, internally managed. It originates first mortgages ($2.9 billion, 60% multifamily), holds $2.3 billion of real estate securities that are almost all AAA and owns net-leased properties.

How much does it pay?

10.8%

A year. For every $100 invested at today's price ($8.50), about $10.82 a year in regular dividends, before taxes.

$0.23 a quarter.

Do earnings pay the dividend?

152%

Distributable earnings for the quarter paid the whole dividend.

Distributable earnings per share for the quarter
$0.35
Dividend per share for the quarter
$0.23

Did book value per share grow?

−1.5%

Change over 12 months. Book value per share of $13.50 on the latest balance sheet (+0.4% in the quarter).

A year ago
$13.71
Previous quarter
$13.44
Latest balance sheet
$13.50

What does it cost against book value?

0.63x

Needs attention: below 0.80x

The share costs $8.50 and book value per share is $13.50. You pay $0.63 for every $1.00 of book value: a 37% discount.

Where does the money sit?

A portfolio of $6.04bn. Total assets.

  • Commercial real estate loans49%
  • Real estate securities38%
  • Owned property11%
  • Cash and other2%

What to watch

  • Distributable earnings of $0.35 a share in Q3 2026 include a $31 million gain on the sale of an office campus in Jacksonville. In the previous quarter they were $0.24, one cent above the dividend.
  • Adjusted leverage of 2.5x, the lowest of the three commercial lenders on the list; 38% of the assets are securities, 97% of them AAA.
  • Office is 21% of the loan portfolio. Two loans are on non-accrual ($61 million), against four ($130 million) at the end of 2025.
More figures for LADR
Management
Internally managed
Head office
320 Park Avenue, New York
Exchange
NYSE, since 2014
Book value per share
$13.50
Undepreciated, the company's measure; GAAP is $11.61.
Earnings per share (distributable earnings)
$0.35
Includes a $31m gain on a property sale; $0.24 in Q2 2026. GAAP result: $0.53 a share.
Leverage (debt to equity)
2.5x
Adjusted; 69% of the debt is unsecured.
Portfolio size
$6.04bn
Total assets.
Asset mix
Loans 49%, securities 38% (97% AAA), real estate 11%
Loans by property type
Multifamily 60%, office 21%, industrial 7%
Credit loss allowance
$43.6m
On non-accrual
Two loans, $60.6m (four and $129.7m at Dec 31, 2025)

Q3 2026 balance sheet (Sep 30, 2026), reported Oct 16, 2026. Sources: Ladder Capital, Q3 2026 results (opens in a new tab), Oct 16, 2026; Q3 2026 earnings supplement (opens in a new tab), Oct 16, 2026; Q3 2026 Form 10-Q (SEC) (opens in a new tab), Oct 16, 2026; price: Yahoo Finance, Nov 13, 2026.

The list is public. What goes into your portfolio is a conversation.

None of these ten companies is a recommendation. Which ones go in, at what weight and next to what depends on your profile, your horizon and what you already hold.

An informational reading of public data, as of the dates shown. It is not a recommendation to buy or sell, not a research report, and does not indicate positions of the thesis or of clients.

Market data (source and date shown). Not a promise of returns. Past performance does not guarantee future results.

Informational material. Read before any decision.

Dollar Academyby Dollar Double Digits

For informational purposes only. This is not an offer, solicitation or recommendation to buy or sell any security or financial product, nor a promise or guarantee of returns. Percentages shown are market data observed at the sources and dates indicated (dividend yield, distribution rate or historical index returns); they are not total returns or expected returns and may change at any time. Past performance does not guarantee future results. International investments involve market, credit, liquidity, currency, tax and loss-of-principal risks; some assets are restricted to qualified or professional investors. Figures are gross, before taxes and fees. Check suitability for your profile and consult your legal and tax advisers before investing.

Taxes: the US and Brazil have no treaty to avoid double taxation; dividends from US assets are usually subject to 30% withholding, and in Brazil Law 14.754/2023 applies. Net yield can be far lower than gross. Check with your accountant.

Dollar Academy is the educational content of Dollar Double Digits, a BlackPuzzle Investments thesis.

blackpuzzle.capital (opens in a new tab)
Contact
contato@dollardoubledigits.capital
Domain
dollaracademy.education

Language and theme

No cookies, no trackers.

Market figures carry their source and the date they were consulted.